15 Signs of Invalid Traffic from Your Analytics Tools
Learn how to detect and eliminate invalid traffic using analytics tools and key metrics. This guide covers practical steps to ensure your ads reach real users.
Topics
What to Read Next
- TripleLift Announces Partnership with Attain to Unify Context and Commerce
- Seedtag Partners with IRIS.TV to Expand Contextual Signals for CTV Targeting
- Magnite, Cognitiv Announce Deep Learning Integration for Real-Time Curation
- Dscout Announces Integration with HeyMarvin
- Comscore Launches Program-Level Capabilities within CCM

Did you know that 22% of ad clicks are invalid and nearly half of all internet traffic comes from bots? This rampant fake activity is draining advertisers’ budgets. The good news? You can identify and eliminate fake traffic by analysing your data. It’s simpler than it seems—just focus on the right metrics and indicators.
In this guide, we’ll show you how to detect invalid traffic and ensure your ads reach genuine users who are more likely to convert.
What You’ll Need to Identify Fake Traffic:
- A Google Analytics account (or a comparable analytics tool)
- Access to your server log files
- Reports from your DSP and ad server
- A spreadsheet tool like Excel or Google Sheets to combine data
We’ll focus on Google Analytics, the most widely used analytics solution (with over 55% market share), but these tips apply to other platforms too. Stay tuned for actionable steps and examples from various tools to help you optimise your campaigns.
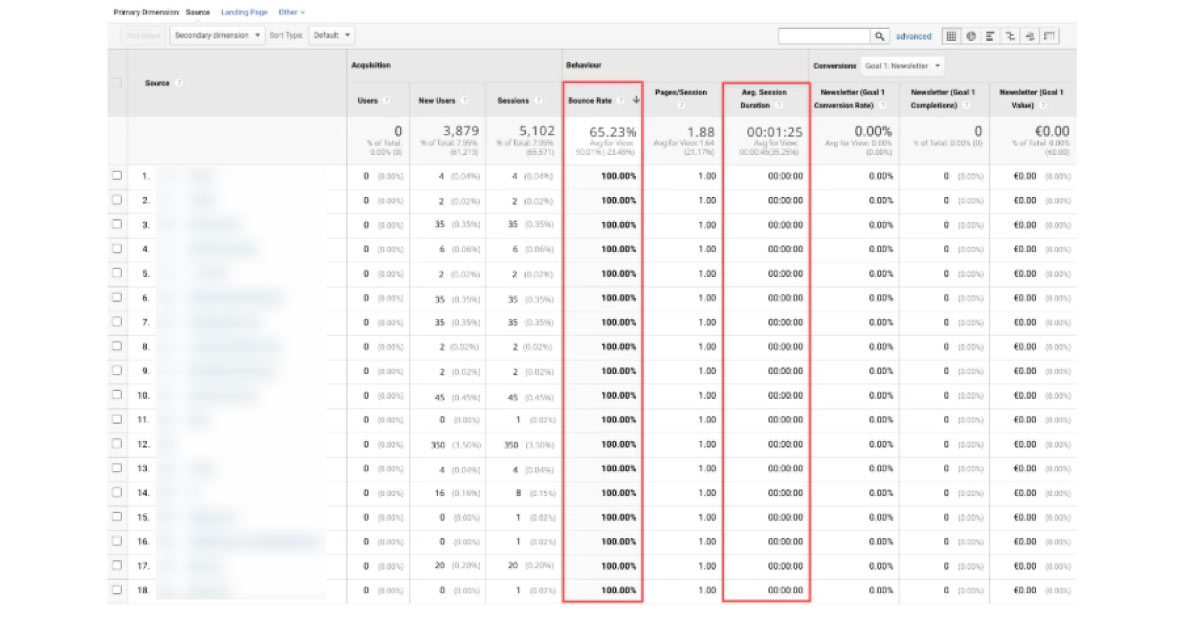
Indicator #1: Bounce Rate Near 0% or 100%
Bounce rate measures how often users leave your site after viewing only one page. Google defines it as “a single-page session on your website […] that triggers only a single request to the Analytics server.”
How Bots Affect Bounce Rates
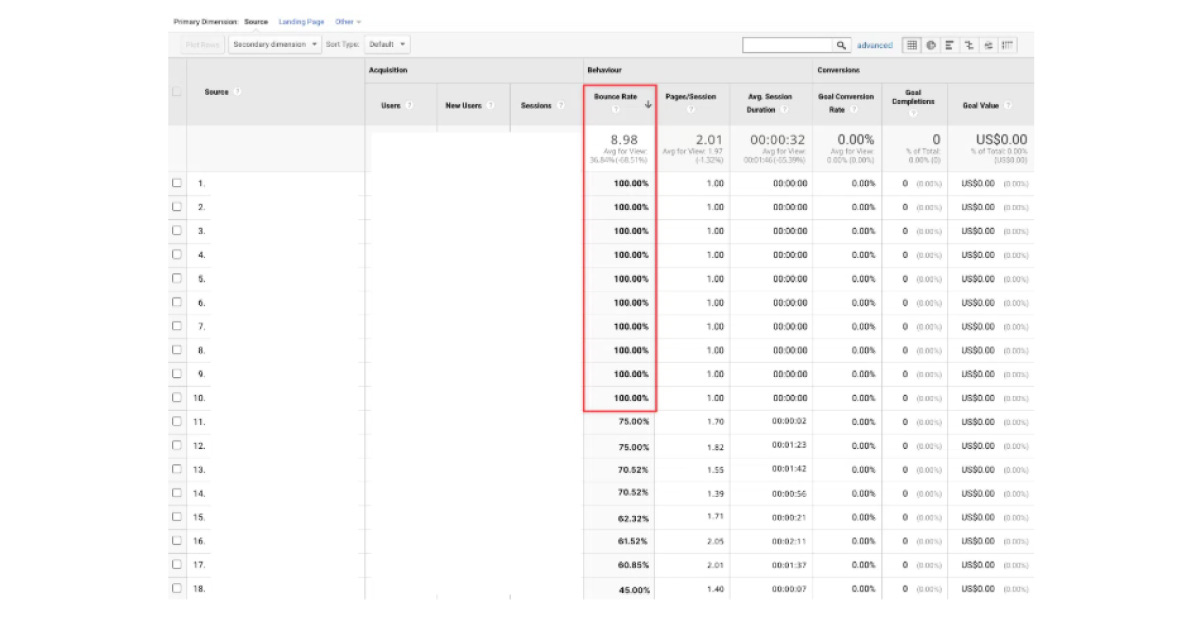
Human users show varied behaviour—some leave quickly, others explore multiple pages or trigger events like downloads. Bots, however, follow repetitive patterns. They either leave immediately (causing a 100% bounce rate) or mimic browsing behaviour, resulting in a near 0% bounce rate.
Red Flags to Watch
While bounce rates vary by industry and page type, anything below 30% or above 70% should prompt further investigation. Bots often cause:
- 100% Bounce Rate: Immediate exits.
- 0% Bounce Rate: Programmed multi-page visits to mask bot activity.
How to Check Bounce Rates in Google Analytics
- Overall Bounce Rate:
- Go to “Audience” → “Overview” for a site-wide view.
- Page-Specific Bounce Rates:
- Navigate to “Behaviour” → “Site Content” → “All Pages” and search for your campaign’s landing pages.
- Referring Domains:
- Go to “Acquisition” → “All Traffic” → “Channels” → “Referral” to find domains with abnormal bounce rates. Domains sending traffic with nearly 100% bounce rates are likely sources of invalid traffic.
By analysing these metrics, you can spot suspicious patterns and block questionable domains to improve campaign performance.
Indicator #2: Average Session Duration Close to 0 Seconds
A session includes all user interactions on your site during a specific time frame. Bots, however, complete their task—clicking your ad—almost instantly, resulting in near-zero session durations. (Google)
How Bots Affect Session Duration
Bots typically leave your site immediately after clicking an ad to move on to their next target, causing:
- Near 0-Second Session Duration: No engagement, as bots have no interest in your content.
- High Bounce Rates: Immediate exits align with this behaviour.
Real visitors usually stay for at least a few seconds, so traffic with 0-second durations is likely fake.
Checking Average Session Duration in Google Analytics
- Overall Session Duration:
- Go to “Audience” → “Overview” for site-wide data.
- Page-Specific Session Duration:
- Navigate to “Behaviour” → “Site Content” → “All Pages” and analyse your landing pages.
- Referring Domains:
- Go to “Acquisition” → “All Traffic” → “Channels” → “Referral” to identify domains with unusually low session durations.
Domains with near-zero session durations likely generate invalid traffic. Investigate and exclude them to optimise your ad campaigns.

Indicator #3: Unusual Traffic Patterns
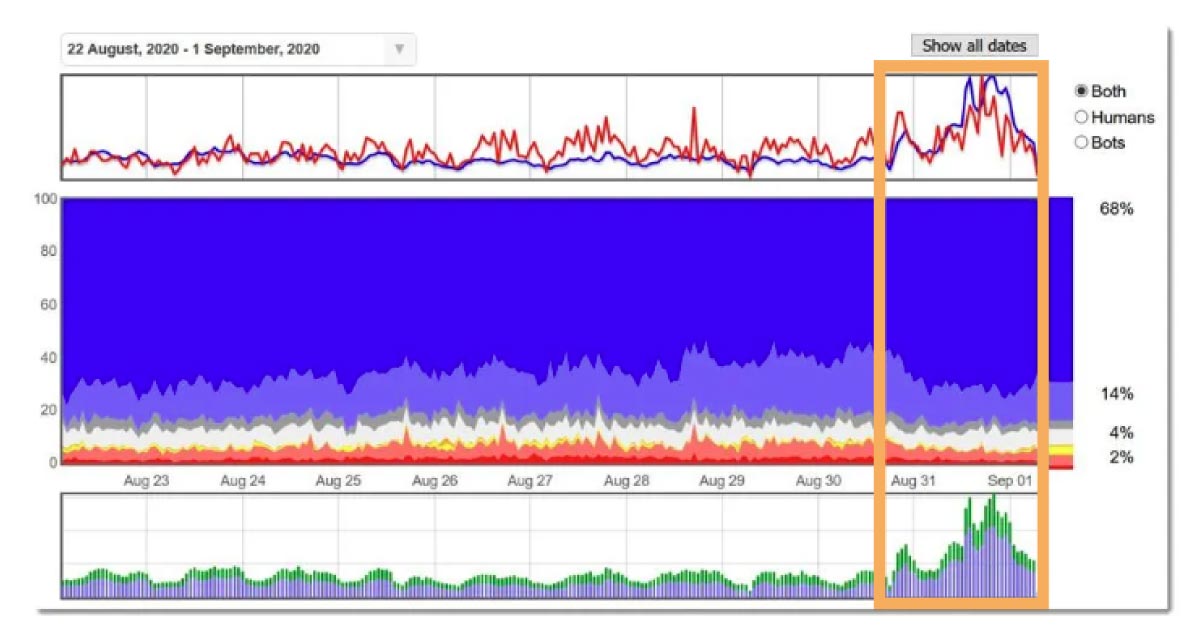
Watch for unexpected traffic spikes during your campaigns. For example, if your site typically gets 5,000 visitors daily but suddenly jumps to 30,000 without any changes on your part, this could indicate bot activity.
Signs of Unusual Traffic
- High Bounce Rates and Low Session Durations: A sudden influx of visitors with poor engagement metrics likely signals bot traffic.
- End-of-Month Spikes: Some websites use bots to meet traffic quotas, leading to noticeable peaks at the month’s end.
How to Detect It
Compare traffic patterns from the last few days of the month to earlier periods. Spikes with unusual behaviour metrics should prompt further investigation.
Check Hourly Traffic Patterns for Irregularities
Take a closer look at hourly traffic data over several days. Real human traffic follows a predictable, bell-shaped curve—starting in the morning, peaking around noon, and tapering off in the evening.
Red Flags in Hourly Data
- Nighttime Spikes: Unusual traffic peaks during late-night hours likely indicate bot activity.
- Flat Patterns: Consistent traffic levels throughout the day suggest automated, non-human traffic.
Investigate these patterns to identify and block sources wasting your ad budget.

Indicator #4: Referrers with Zero Conversions
If a referring domain drives thousands of visitors but shows a 0.0% conversion rate, it’s likely bot traffic.
- Action Step: Check referrer conversion rates in Google Analytics, block poor-performing domains, and monitor for improvements. If conversions remain unchanged, the traffic was fake, and you can leave those domains blocked.
Indicator #5: Unusual Geolocations
Receiving significant traffic from unexpected countries, like India or Bangladesh, could indicate click farms or botnets.
- Action Step: Analyse traffic sources by geolocation. If traffic comes from non-target regions, apply negative targeting to prevent your ads from displaying there.
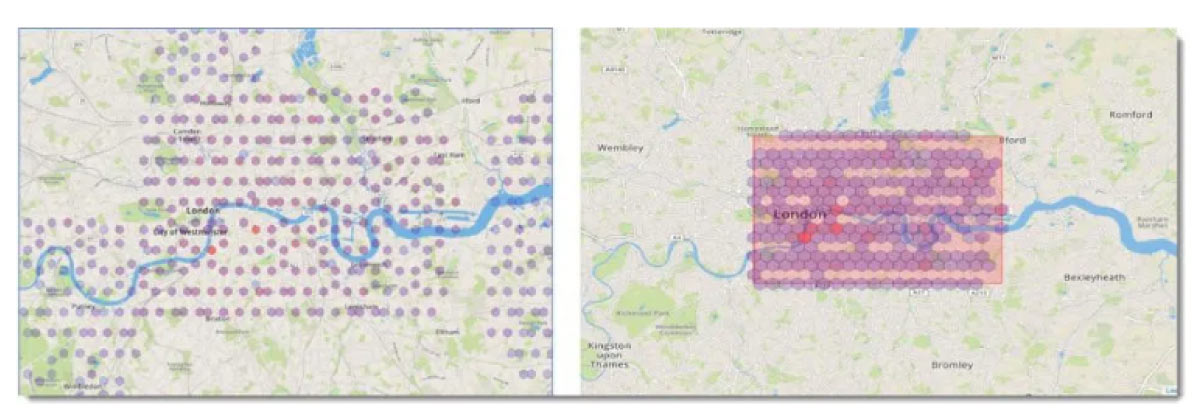
- Advanced Check: Fraudsters may use proxies to mimic legitimate locations, so scrutinise geolocation reports for unusual patterns, like device clusters forming unnatural grids.
How to look up the geolocation of your visitors in Google Analytics
- Go to the “Audience” page on the left
- Click the “Geo” → “Location” page to get an overview of the geolocation of your visitors.
In this report, you also get metrics like bounce rate and average session duration for each country and can act accordingly. In addition to country, you can also add either a landing page or referrer as a secondary dimension, which helps you narrow down invalid traffic even further.
Indicator #6: Duplicate IP Addresses in Your Log Files
While bot developers now use proxies and malware to evade detection, duplicate IP addresses in your log files can still signal click fraud.
- Action Step: Check your log files periodically for IPs exceeding a reasonable threshold (e.g., 5 clicks). Humans rarely click the same ad multiple times.
- Block Fraudulent IPs: Work with your IT team to analyse logs and exclude suspicious IPs from displaying your ads.
How to exclude IP addresses from Google Ads
Google has an in-depth page about how you can block IP addresses in Google Ads from seeing your ads. Following the most important steps:
- Sign in to your Google Ads account.
- In the page menu on the left, click Settings.
- Select the campaign you’d like to exclude IP addresses from.
- Click to expand the “IP exclusions” section. (Click Additional settings if you can’t see the “IP exclusions” section.)
- Enter the IP addresses you want to exclude from seeing your ads.
- Click Save.
Indicator #7: Ads served to the same devices
As we mentioned in the previous indicators, most bots are programmed to do the exact same thing over and over again. The same applies to the technology underlying the bots with which they click your ads – the browser engine.
Bots do not use a browser like humans do. They do not need a graphical user interface (GUI) because they interpret the code directly. As a result, bots often use “headless” browsers – a web browser without a graphical user interface that is executed through a command line interface or via network communication. No person interested in your product or service would ever visit your website using a headless browser.
Therefore, you should definitely check the user-agents of your traffic regularly. Most headless browsers send the “headless” information with their user agent by default. Here you can find a list of known headless user-agents.
But bot developers are smart people, so they either change the user agent or use emulation tools to emulate real devices. With normal-looking user agent strings, it will be harder for you to detect bots, but not impossible.

Look in your analytics or log files for anomalies. This could be either an influx or a high concentration of user agents, such as an older Android version that is responsible for a significant portion of your daily traffic. Even though Android does not have such a strict update policy as iOS, the majority of users use the latest versions, so it is very unlikely that you will receive a large amount of traffic from older devices.
With that in mind, look for two things in your analysis and log files: User agents that indicate a headless browser, and a high volume of unlikely user agents (exotic browsers, outdated operating systems, etc.). Next, you want to find out where these users are coming from and block the domain from further displaying your ads.
Indicator #8: Unfamiliar Referral Traffic
Suspicious referral traffic often comes from unknown or gibberish domains, many of which lack public content and are used solely for ad serving.
How to Detect Fake Referrals:
- Check Metrics in Google Analytics:Go to “Acquisition” → “All Traffic” → “Channels” → “Referral” to review domains, bounce rates, and session durations.
- Request a Placement Report:Ask your media agency for a list of domains and apps displaying your ads. Sort by impressions and review questionable entries.
Action Step:
Analyse referral traffic monthly and block suspicious domains to avoid wasting your ad spend. Be cautious of malware when verifying domains.
Indicator #9: Very high click-through rates (CTR)
Display ad click-through rates vary slightly by industry, but the average click-through rate for the Google Display Network (GDN) across all industries in 2020 was 0.47%. Similar numbers were published by WordStream in 2018: they found that the average click-through rate for GDN in 2018 was 0.46%.
Google Display Network is the largest global display network and reaches 90% of internet users worldwide, so these figures are basically a benchmark for display advertising.
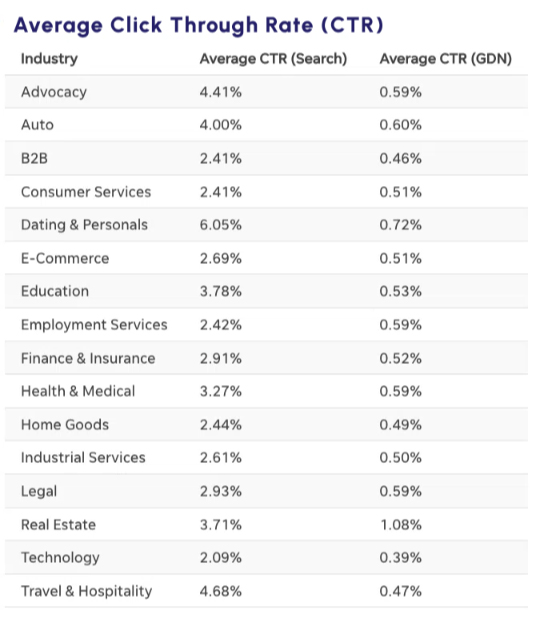
It should be noted that it is not clear to what extent these figures have been adjusted for bot traffic. The average CTR for real human traffic could be and very likely is much lower!
With these numbers in mind, you should now review your placement reports from your demand-side platform (DSP) or ad server. Any referrer domain that has a significantly higher CTR than the one you see in the image above should be investigated. In some cases, referrer domains have a CTR of up to 100%, which should immediately set off alarm bells for you!
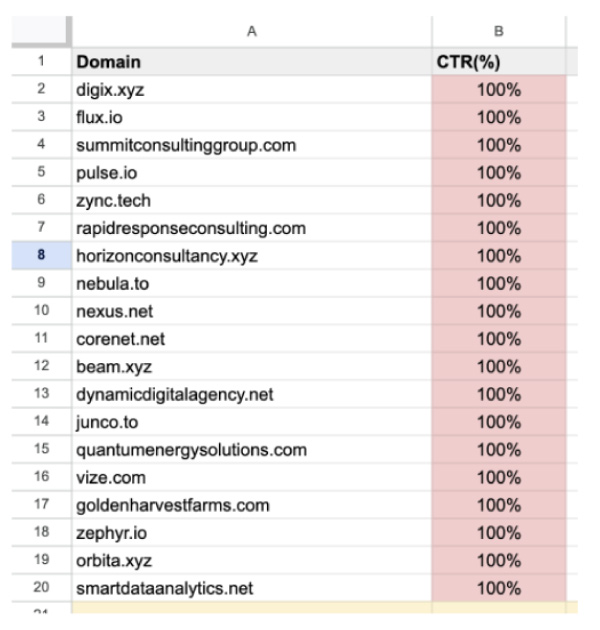
After you have examined all the websites, you should put them on a block list and stop buying ads from them.
Indicator #10: Campaign Report Anomalies
Track your campaign performance using URL parameters like UTM tags. Compare incoming traffic parameters with those you set up—any unrecognised parameters likely indicate fake traffic.
How to Check in Google Analytics:
- Go to “Acquisition” → “Campaigns” → “All Campaigns”.
- Filter by parameters such as “Campaign,” “Source,” or “Medium.” Flag any unexpected entries.
Indicator #11: Ad Serving Volume by Domain
If most of your ads are displayed on just a few domains, your reach is being limited. Review ad server reports to check the distribution of domains.
- Action Step: If ad impressions are overly concentrated, adjust settings to limit frequency on these domains and broaden your reach.
Indicator #12: Abnormal Data Consistency
Unusual consistency across metrics (e.g., bounce rate, session duration, or traffic patterns) can indicate bot activity. As Dr. Augustine Fou says, “When things are too high, too low, or too consistent, investigate further.”
Combine metrics for a more comprehensive view of referral domain performance to identify.
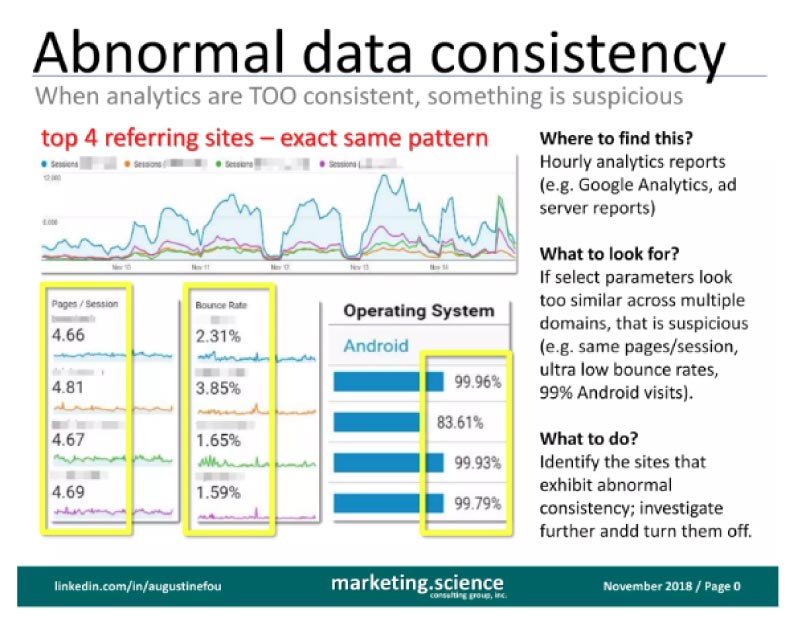
The image above shows you an example of 4 referring domains where, strangely enough, all users behave exactly the same way and have very similar patterns:
- They visit about 4.7 pages during a session
- Very low bounce rate
- Everybody uses Android
It does not take much mental effort to come to the conclusion that these websites are sending you fake bot traffic that is programmed to behave just like that. The combination of different metrics you should keep an eye on is limitless. It could be a specific browser type in combination with a specific geolocation, or a specific screen resolution in combination with a specific average session duration.
Anything that is consistent over a period of time should be investigated to avoid wasting your advertising budget. Start examining and working with the data you already have, and you will start to see those patterns, too.
Indicator #13: Ad Serving Volume by Hour
Review hourly ad server data to identify when most ads are served. If ads are heavily served during night hours, your budget could be wasted early, leaving no impressions for the day.
- Action Step: Stop ad delivery during specific hours (e.g., 10 PM–6 AM) or apply frequency caps on certain domains.
Indicator #14: Extremely High Win Rates
Win rates—impressions won vs. bid—are typically around 10%. Win rates exceeding 50% on certain domains suggest fraud, such as ad stacking, where ads are hidden beneath others and never seen.
- Action Step: Check win rates via your DSP or media agency. Sort domains by impressions won and block those with abnormally high rates.
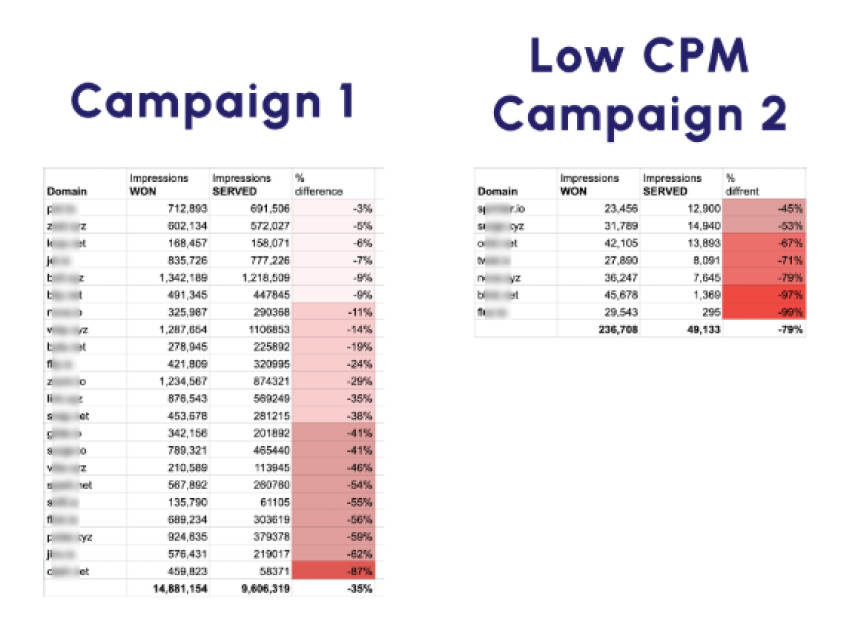
Indicator #15: Mismatch Between Bids Won and Ads Served
If you win bids but few or no ads are served, there’s likely fraud. Normally, a winning bid should result in an ad being served (1:1 ratio).
- Action Step: Compare DSP data (bids won) with ad server reports (ads served). Investigate domains with discrepancies over 10–15% and consider blocking them.
You have a lot of data at hand – you just have to use it!
Hopefully, we could give you some tips and tricks on how to detect fake bot traffic and optimise your ad delivery with your existing analytics data. Most bot traffic is obvious if you know what to look for, you just have to do some groundwork and start digging.
We are confident that if you follow these steps, your ad performance will improve dramatically. Remember: Do not rely on executive summaries from your media agencies, DSPs or ad servers. Always request the complete raw data you can work with!
READ MORE: Preventing Ad Fraud During Black Friday and Beyond


