How To Use Cohort Analysis To Reduce Churn
Cohort analysis can spot the exact juncture in the user journey where users are skipping out. The user journey can then be streamlined to make them stay longer The key to any great customer retention strategy is building a true relationship with each and every customer. One way to understand if you’re creating relationships that […]

Cohort analysis can spot the exact juncture in the user journey where users are skipping out. The user journey can then be streamlined to make them stay longer
The key to any great customer retention strategy is building a true relationship with each and every customer. One way to understand if you’re creating relationships that will stand the test of time is through cohort analysis. This method examines the shared traits of a group of customers and uses analytical patterns to identify the best ways to reach the group.
Cohort analysis is valuable because it can:
- Predict future user behaviour with present data
- Identify features, activities, or changes for user retention
- Proactively plan for customer engagement activities based on feature adoption
- Put in place a non-intrusive marketing system that is purely data-driven
Typically, cohorts are created and examined based on:
- Acquisition – grouping users based on when they joined the app and the kinds of products purchased. For example, a consumer mobile app for productivity can track its acquisition cohorts daily. On the other hand, a B2B mobile app with a focused user group would concentrate on monthly acquisition.
- Behaviour – the patterns displayed while using your app. For example, users who share photos using Google Photos links on a given day – the period of time, again, varies from app to app. For a photo-sharing app, a day is a suitable timeframe. For an online investment platform app, three months would be more apt to observe user behaviour.
Cohort analysis is commonly used to identify why and when customers churn and what can be done to prevent them from leaving. That brings us to the calculation:
Customer Retention Rate
CRR = ((E-N)/S) X 100
E – The number of customers at the end of the time period
N – The number of customers acquired during that period
S – The number of customers at the beginning (or start) of the period
A higher CRR means higher customer loyalty. By benchmarking your business CRR with the industry average, you can see where you stand in terms of customer retention.
If CRR shows a bleak picture, corrective measures can be taken with the help of data analysis. This is where cohort analysis can help.
Some of the important metrics to focus on while using a cohort analysis for customer retention include:
- Repeat Rate: There is no other metric that excels at proving success in customer retention. Repeat rate is the share of customers who transact with your business repeatedly compared to cohorts who terminate with a single purchase.
- Orders Per Customer: Closely tied to the repeat rate is the orders per customer metric. More orders that customers make indicate a strong retention rate.
- Time Between Orders: The time between successive orders is a subjective metric. Depending on the type of products/services your business offers, the time period could be hours or even months. This metric can be used to create reactivation emails that will keep the repeat rate high.
- Average Order Value (AOV): The AOV metric helps identify high-value cohorts that can be specifically targeted with marketing campaigns. It helps eliminate spending too much time on cohorts that have low AOV.
Identify The Reasons For Churn
After you put together your hypothesis and identify the reasons for churn across cohorts, you can experiment with solutions to reduce churn by:
- Tweaking the journey: Most often, although not always, your users could churn when the user journey becomes difficult. Cohort analysis can spot the exact juncture in the user journey where users are skipping out. The user journey can then be streamlined to make them stay longer.
- Identifying incentives: Cohort analysis can show what kind of customers buy the most and what products they buy the most. Such data can be used to create incentives like targeted offers, coupons, free shipping, and more that will help retain existing customers.
- Introducing loyalty programmes: Using loyalty points, rewards, and similar gamification systems for customer retention is popular among marketers. With cohort analysis, you can narrow down the exact set of customers who can be retained longer with loyalty programmes.
- Planning reactivation emails: Reactivation emails carry out the task of gently nudging customers (you can select the cohort) when they are ready for the next purchase. Metrics like time intervals between two purchases help properly plan the reactivation drip campaigns to keep customers in the loop.
How The Tech Works
Cohort analysis is powered by Athena-based queries in the backend.
The events performed by the users are evaluated based on their timestamps.
For instance, say a user performs an app-opened event today and then performs the app-opened event again after seven days. Based on these event timestamps, the users are categorised into different retention categories on which the analysis can be performed.
Visibility Informs Future Action
Running a cohort analysis using MoEngage’s Analytics platform is very simple. The UI is intuitive, so all the marketer needs to do is select the events that they want to analyse. MoEngage Analytics is a powerful tool in terms of the analysis that can be derived through cohorts.
To get started, log in to the dashboard and click on Analytics > Cohorts in the navigation panel to your left.
You’ll see the screen as shown below:

At the top of this page, you will find options for Event Selection, Date Range, and Split Functionality. Event Selection determines the analysis and insights you’ll get from the report.
MoEngage enables you to select the desired events to perform cohort analysis.
Here’s what each of these means:
- First Event and Return Event: Select ‘First Event’ to include the user base on which the analysis will run. Select ‘Return Event’ to specify the user action that determines user retention, churn, activeness, time to execute, etc.
- Date Range: The time period for which you want to do the cohort analysis is set in the date range.
With MoEngage, you can choose a custom time period for the cohort. You can compare different cohorts for a specific attribute. For example, you can compare cohorts across different cities, mobile device platforms, categories, product types, and more.
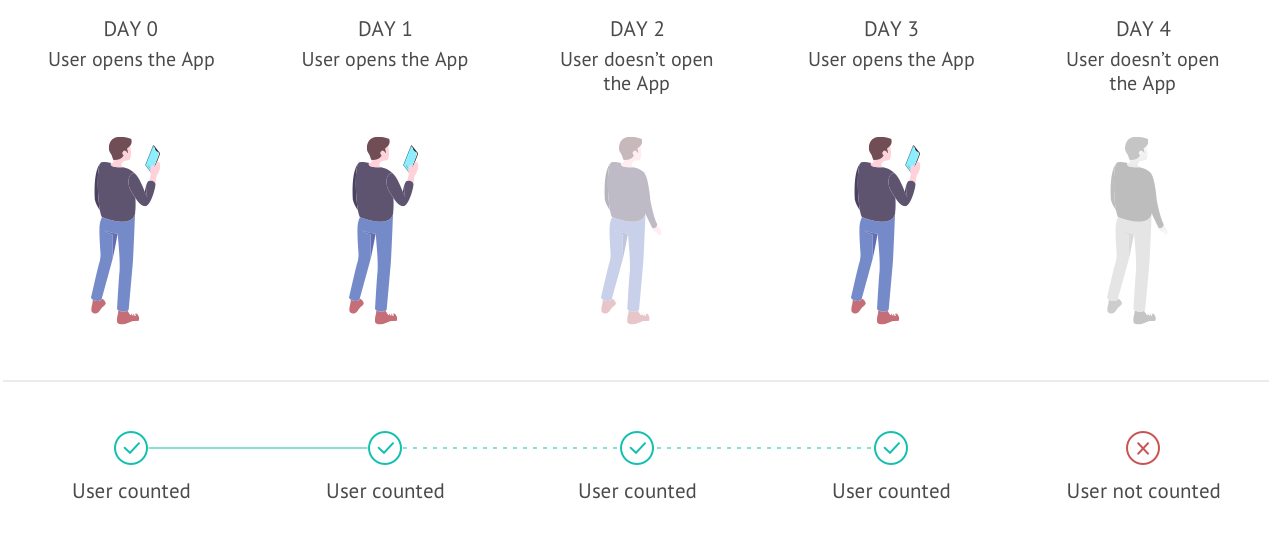
Retention Cohort – Cohort retention analysis can help you understand the percentage of user retention on your app retained until the defined day. This includes users who have performed the Return Event until the selected day or later.
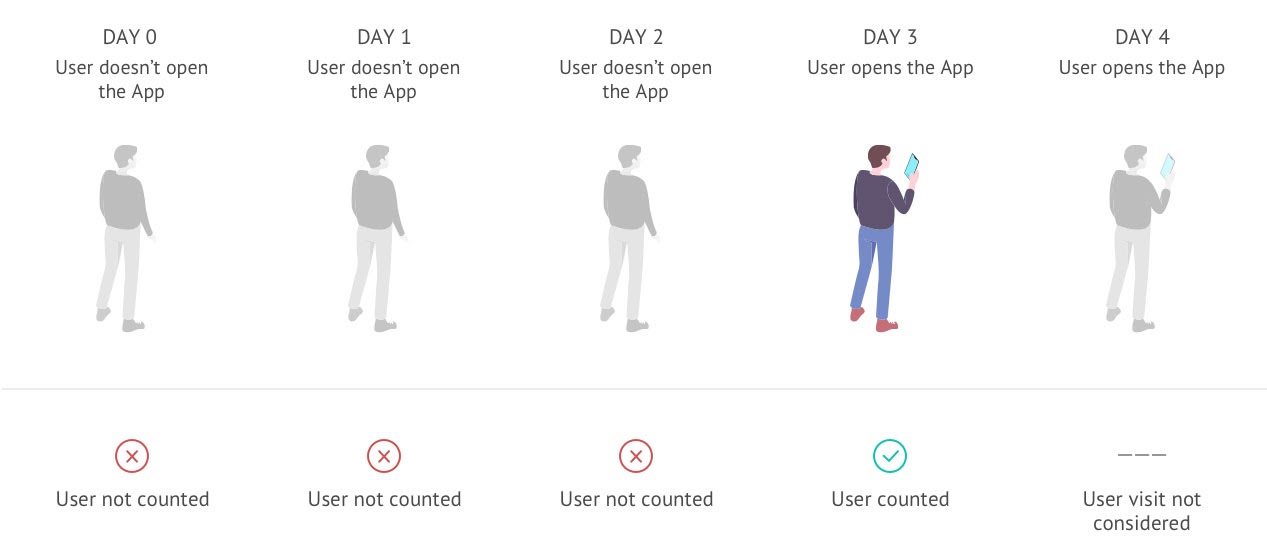
Return Visit Cohort – Return Visit Cohorts indicate the percentage of users who have returned to your website/app on a specific day. This can also be understood as the percentage of users away from the app/website until the selected day.
MoEngage Cohorts empowers businesses with data that helps measure and drive user retention.
The benefits include;
- Virtual representation of data: You don’t have to skim through rows and columns of data to make sense of your customer behaviour. MoEngage gives a quick glance at your cohort analysis in a graphical form that requires no further interpretation.
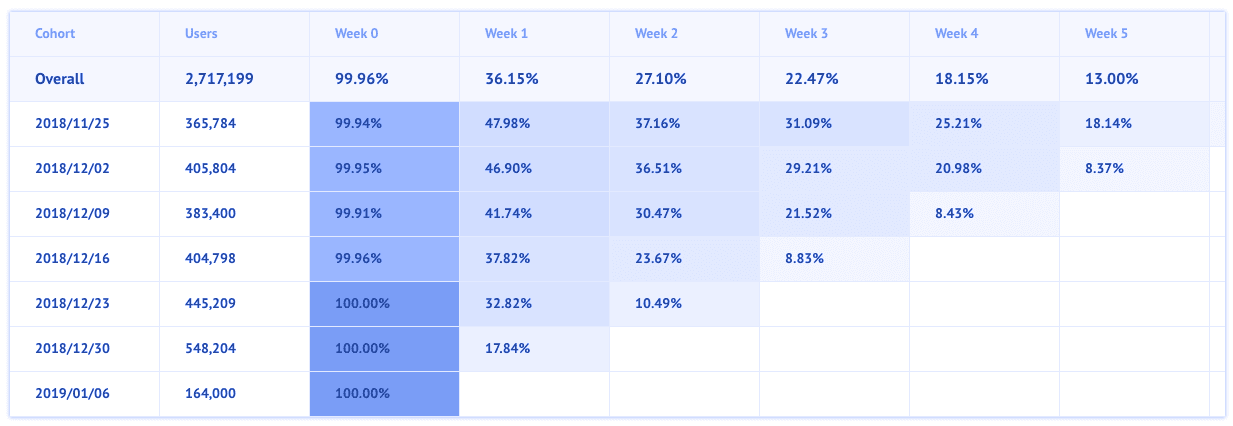
- Colour coding for easy interpretation: There are also colour-graded cohort table reports where you can see tabulated data of retention or return visits. If required, you can also drill down to hourly, weekly, or monthly visits for a better understanding of user behaviour.
- Download and reuse anywhere: Data becomes more powerful when it goes around. This solution allows you to download the cohort analysis reports in chart form or as a PNG/CSV file for sharing.
If you liked reading this, you might like our other stories
Explained: FLoC (Federated Learning of Cohorts)
Time To Add ChatGPT To Your Content Marketing Team?